Execution factor
Senior-engineer hours multiplied by 60, divided by agent minutes, as a ratio of sums over the whole record. The mean of per-task factors is kept and labeled as the task mean; it is never the headline.
Features
Thirty-three features in seven groups, every one shipping in the current release, with the same service layer under every surface. Nothing on this page is a roadmap.

See it in action
Views from a running installation. Each screenshot follows the theme toggle in the header: dark by default, light on request.


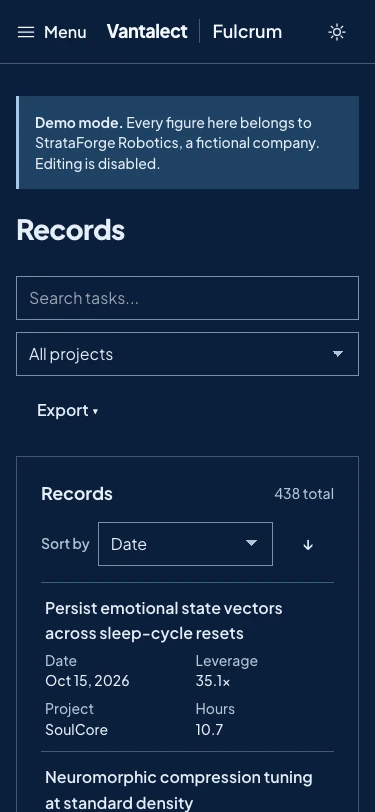
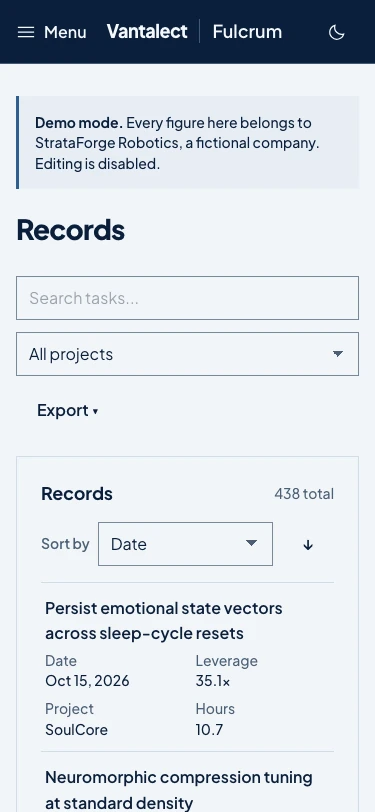
Demo data. These screenshots come from a demonstration installation. Every figure in them belongs to StrataForge Robotics, a fictional company, and none of it is a customer's record.
The numbers that matter
Senior-engineer hours multiplied by 60, divided by agent minutes, as a ratio of sums over the whole record. The mean of per-task factors is kept and labeled as the task mean; it is never the headline.
The same hours divided by the minutes you actually spent: prompt, active supervision, correction, and review, which must reconcile to the total. Computed only over records with complete operator-time coverage, and every result states the covered count and percentage.
Aggregate execution factor, median task factor, arithmetic task mean, aggregate operator leverage, calendar compression, and capability expansion, each with a formula identifier so a reader can recompute it.
Task level divides senior-hours by wall-clock span. Period level requires the union of intervals; overlapping spans are never summed as unique calendar time.
Work that needed new learning, or was infeasible unaided, is classified and counted. No invented or infinite hour estimates, ever.
The derived factors are generated PostgreSQL columns, recomputed on every write. No stale numbers, no client-side arithmetic, no two surfaces disagreeing.
Written at the time of the work
Records, summaries, time series, project breakdowns, the day view, fatigue, prediction, project renames and merges, and cost and optimizer reports, callable by any MCP-capable agent at the end of a task. The input schema of record_leverage is derived from the same record model the API validates, so an agent cannot silently drop a field.
leverage add creates or idempotently updates a record from any shell or script, with every provenance field available as a flag, through the same API the dashboard uses.
/api/v1/records, analytics, fatigue, prediction, projects, users, and teams. OpenAPI-documented; the CLI, the MCP server, and the dashboard all consume it.
A client-generated record id is unique within an account. Retrying a create or a completion with the same id returns or updates the same canonical record instead of duplicating it.
Tokens are exact, estimated with a named rate, or unavailable. Estimates carry a basis and an author. Nothing is a bare integer with no story.
A correction never overwrites. The original row stays, the correction supersedes it, and public outputs carry only the effective record.
Load historical records from CSV. A row that matches an existing user, date, and task is skipped and counted, so a spreadsheet migration or a re-run never doubles the record.
See the full picture
Totals and factors by day, week, month, or any window, with the record count and coverage that make each figure defensible.
Per-project breakdowns tie leverage to the codebases it came from, with commit and session identifiers on every record. Projects can be renamed and merged without touching a record.
One call for the day so far: records, factors, hours saved, and the current fatigue level. The day view buckets those records into 24 hours and replays the fatigue curve over them.
React 19 and Recharts: the time series, project breakdowns, a fatigue gauge, leaderboards, and the records table. Both themes, follows the system preference, WCAG 2.1 AA contrast throughout.
A record is a draft until confirmed. Publication requires an approved review and a public-safe restatement of the task; raw task text never crosses the boundary.
Search every task description you have ever logged; export any date range or project as CSV or JSON. The record is yours, and it is portable.
Every record can carry a dollar cost priced per model from its token breakdown. The cost page shows total spend, cost per task, hours saved per dollar, and leverage per dollar, by model and by activity, with a yield split (productive, reverted, abandoned) and an optimizer grade.
Protect your judgment
A continuous score from today's confirmed records: record count at half weight, cumulative operator minutes and session duration at a quarter each, less a recovery discount for time away from the keyboard. Grounded in the research on glutamate accumulation in the lateral prefrontal cortex during sustained cognitive work, not a mood survey.
Low at 0 to 3 records, Moderate at 4 to 7, High at 8 to 12, Very High at 13 and up. The level is what the agents read.
Priority-ranked interventions with the rationale attached, calibrated to the current level, the time of day, and the work pattern, rather than generic advice to take a break.
Guidance the agents apply to themselves. At low fatigue they ask clarifying questions; at high fatigue they minimize decision points, choose the conventional path, and present completed work rather than options.
Know before you start
predict_leverage finds the most similar tasks in your own record and estimates the factor for the one you are about to start, so a team plans against its own history rather than a vendor's benchmark.
For more than one operator
Personal records roll up to teams. Leaderboards rank by execution factor over any window, with the same coverage rules as the published metrics.
Per-user keys, hashed with argon2id at rest, created, revoked, and regenerated from the dashboard or the API.
Mutual TLS from your fleet, service tokens for other services, and OpenID Connect sign-in for people, in that order of precedence.
One hundred requests a minute per client by default, configurable, so a runaway script cannot take the API down for everyone else.
Installed where your engineers work
FastAPI on Python, SQLAlchemy 2.0 with asyncpg, PostgreSQL 17, and a React dashboard built by Vite. The API builds as a container image and runs on ECS, Kubernetes, or a single Docker host.
Alembic migrations and a seed for first boot. A fresh database is ready in one command.
A health endpoint for your load balancer, unauthenticated, so it works before anything is signed in.
One immutable publication build emits CSV, JSON, summary, time series, methodology, corrections, and a manifest with SHA-256 for every sibling file. The website, the download, and the daily rollups all consume the same snapshot.
How it works
At the end of the task the agent records the description, the senior-engineer estimate, the agent minutes, and the operator minutes, through MCP, the CLI, or the API.
The database computes the execution and operator factors on write. The dashboard, the CLI, and the API read the same columns.
The day's confirmed records drive the fatigue score, the level, the recovery recommendations, and the guidance the agents apply to themselves.
Confirm drafts, review corrections, and publish a snapshot with a manifest and hashes when you want a record other people can check.
Technical specifications
Licensing
One annual license installs Fulcrum in your environment: the API, the dashboard, the CLI, and the MCP server your agents already know how to call. $1,199 per year. Included for a year with every Vantalect leverage engagement.
Installed in your environment, on your hosts, under your identity provider.